Affordability of Food during the Covid-19 Pandemic
By Thilani Kaushalya and Dilshani Ranawaka
Ganga is a 43-year-old married woman living just 12 km away from the Colombo city centre. Her husband is a full-time employee in the private sector, and her only child is a student. She earns some income from self-employment activities like sewing while managing household activities. In a recent conversation, she revealed that their three-member family has spent about Rs. 35,000/= for food during the last month, July, leaving only about Rs. 10,000/= for other non-food expenses: education, health, transportation, utility bills, and loan repayment. For their family, this tight financial situation in July is not an exception but the norm in the other months too. Limited budget motivates her to follow cost-cutting strategies in purchasing household items. However, recent mobility restrictions have affected these coping strategies. For example,
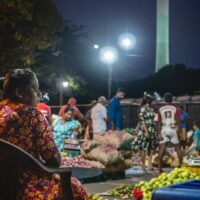
“Because of the pandemic-induced mobility restrictions, we could not go to the wholesale markets that we usually buy rice, vegetables, and fish, where the food items are much cheaper. Instead, we had to purchase our food from the nearby boutiques where food items are expensive,” she reflected.
Based on her story, Ganga’s family spend nearly 78% of their income on food. On average, an urban household in Sri Lanka spends 31% of their expenditure on food in 2016. However, an average urban household earns Rs. 89,000/= per month in 2016, which is two times higher than Ganga’s family income [1]. This blog looks at the affordability of food during the COVID-19 pandemic.
Informal workers are the worst hit by the pandemic
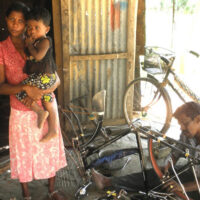
While some households were stocking up food with panic buying, most families could not even afford basic food due to loss of employment and income sources. Those who work in the informal sector as daily wage earners are affected worst [2]. To make things worst, informal-sector workers are not benefiting from the social protection programmes generally available for formal-sector workers. According to the Labor Force Survey Report in 2019, informal sector employment to total employment is about 57% in Sri Lanka, and in the agricultural sector, this ratio is 89% [3]. A study found that by May 2020, 71% of households in Sri Lanka experienced either a complete or partial loss in income, contributing to ‘new poor’. Potential income losses at the household level are higher across towns and cities (30% reduction) than in rural areas (25% reduction) [2].
In contrast, public sector employees received an uninterrupted monthly salary during the pandemic. Yet, some private-sector employees received only half of their salary due to production disturbances. Table 1 shows that the public sector workers represent only 15% of the workforce during 2019 [3].
Table 1. Employed population by employment status – 2019
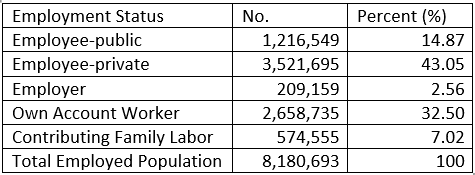
Source: LFS, 2019 [3]
Low-income families are affected the most
It’s a well-established fact that low-income families spend a higher proportion of their expenditure on food (Figure 1). Similarly, in Sri Lanka, those who live in the lowest income decile spend nearly 55% of their spending on food, and in contrast, those in the highest income decile spends only 18% on food [1]. Therefore, as a result of the pandemic, low-income families will have to face dire conditions in the short-term (lack calories and micronutrients) and long-term (less disposable income for health and education jeopardising future earning potentials). Even before the pandemic, Sri Lanka’s wasting rate was 9th highest in the world [2].
Figure 1. Monthly food, non-food expenditure, and food expenditure share by income decile – 2016
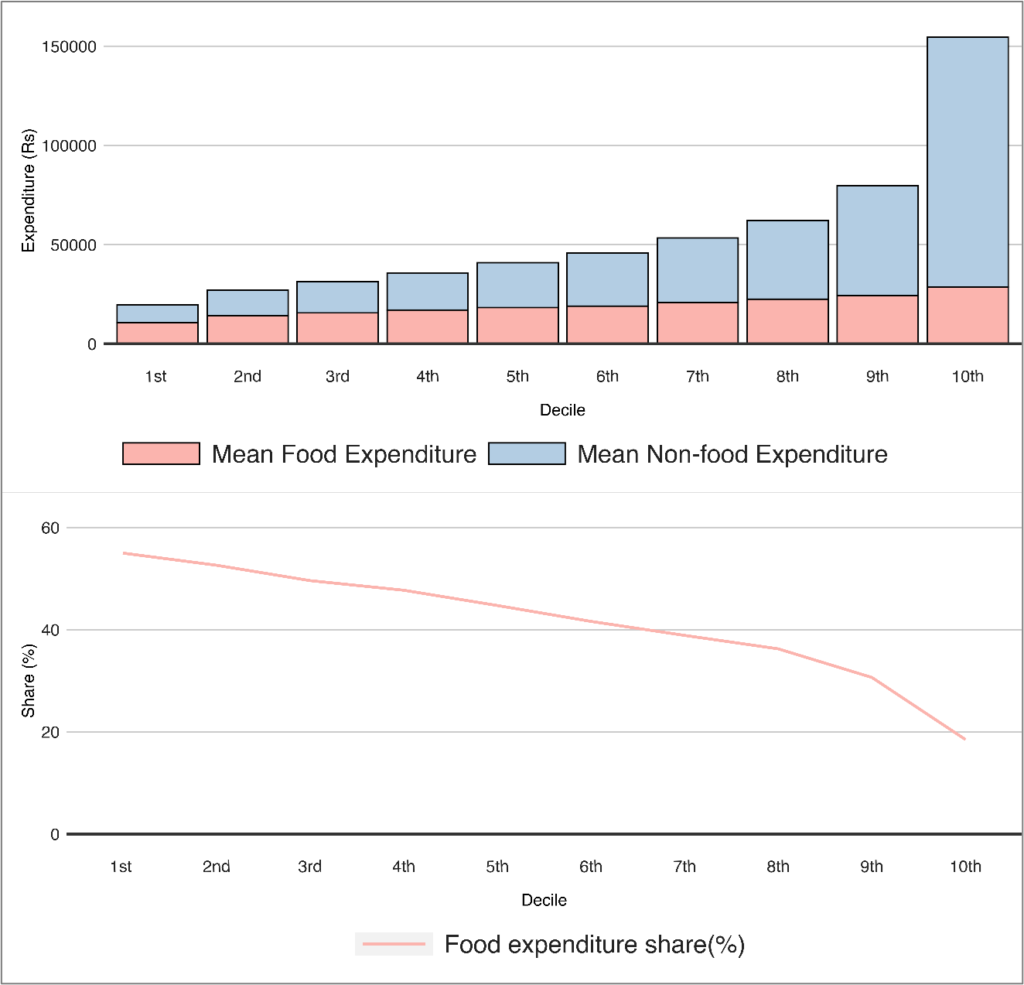
Source: DCS – HIES, 2016 [1]
To exacerbate vulnerabilities, food prices are increasing
In addition to the loss of income and livelihoods, households struggle with higher food prices at the retail level. For example, food inflation in June 2021 was around 11%, recording a 79% year-on-year increase, compared to December 2019 (Figure 2) [4, 7]. One reason for high food prices is supply chain disruptions with island-wide lockdowns, mobility restrictions, and closure of major wholesale markets. However, wholesale market operations are allowed during the third wave of the pandemic.
Apart from the domestic supply chain disruptions, import controls on some food items further increased food prices. For example, the price of turmeric before imposing import controls was Rs. 881/kg in February last week in 2020, and in the first week of July 2021, it was Rs. 2,860/kg, meaning a 224% increase compared to the previous year. Moreover, the price of green gram was Rs. 307/kg in February last week in 2020, and in the first week of July 2021, it was Rs. 902/kg, meaning a 194% increase compared to the previous year [5-6].
Figure 2. Food and non-food inflation in Sri Lanka, 2019-2021 (Base year 2013=100)
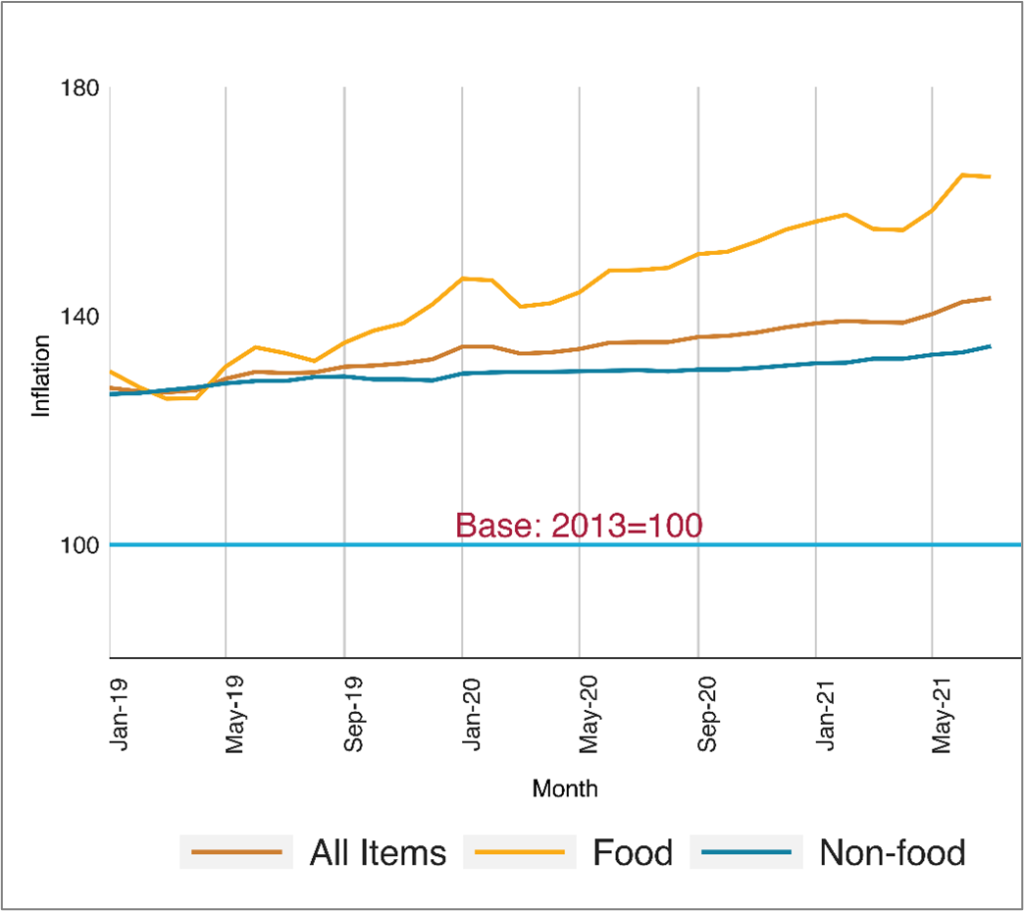
Source: DCS-CCPI data by sub-groups [7]
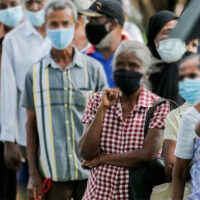
With the double burden of loss of incomes and rising food prices, many households worldwide cut down on the quantity and quality of their food consumption. In Sri Lanka too, a study conducted by UNICEF found that 30% of the households were reducing their food consumption by early May last year. Substantial reductions were reported in more nutritious foods: dairy products, meat, fish, eggs, and dairy, and to a lesser extent, rice and bread [2]. These rising food prices have a more significant impact on low-income families, as they spend a considerable proportion of their income on food. Moreover, within low-income families, women and children are the most vulnerable. For example, the reduction in consumption of iron-rich foods among children may adversely affect their cognitive development. In addition, older people with pre-existing health conditions, poor nutrition could increase the risk of resistance to the COVID-19 virus and other illnesses [2].
Social protection programmes in response to pandemic
Governments in the world implement social protection programmes to reduce the impact of the pandemic on low-income households. For example, the Sri Lankan government provided a monthly cash transfer of Rs. 5,000/= during April and May 2020, and again in April 2021 to the most vulnerable people: Samurdhi recipients, senior citizens, disabled, kidney patients, self-employed, and livelihood-affected people. As of June 2020, the government has spent about 0.33% of its GDP on cash transfers for low-income families [2]. The benefits of cash transfers cannot be overemphasised. However, there are some targeting issues associated with Sri Lanka’s cash transfer programmes. For example, nearly a third of children and older people, and half of single parents/caregivers, are likely to miss out. In addition, transfer of the flat payment of Rs. 5,000/= per household irrespective of the household size may be less effective as larger households tend to be poorer [2].
Lessons Learned and the way forward
• In a crisis like the Covid-19 pandemic, the government should reduce food prices to relieve the burden from vulnerable groups. As an example, the government could eliminate import bans and import taxes on food.
• In the short term, cash transfers should be adjusted proportionately to the household size. Further, the cash transfer value needs to be adjusted for the household-specific vulnerabilities like a higher number of children, disable, the elderly, and members with chronic health problems.
• The relevant departments could invest in maintaining a digitised database for each household and/or household member in the long term. This facilitates more targeted interventions for future shocks without any delay in payments minimising inefficiencies. As an initial step towards digitalisation, the government could develop a central registry for informal workers.
• The pandemic shows us that in addition to poor households, the external shocks could have an adverse impact on non-poor households creating ‘new-poor’. Hence, it is crucial in investing better data to identify in advance the most vulnerable people in the society based on their livelihoods and household demographic characteristics and prepare for adequate social protection programmes.
*For privacy reasons, the name of the respondent has been changed
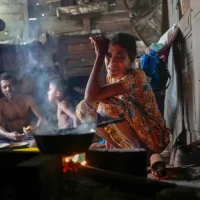
Image courtesy: maxpixel.net
References
[1] HIES Final Report 2016. Household Income and Expenditure Survey 2016. Department of Census and Statistics, Ministry of National Policies and Economic Affairs Sri Lanka. Available at:
http://repo.statistics.gov.lk/bitstream/handle/1/784/HIES2016_FinalReport.pdf?sequence=1&isAllowed=y
[2] UNICEF, 2020. Tackling the COVID-19 economic crisis in Sri Lanka: Providing universal, lifecycle social protection transfers to protect lives and bolster economic recovery, UNICEF Sri Lanka Working Paper. Available at: https://www.unicef.org/srilanka/reports/tackling-covid-19-economic-crisis-sri-lanka-providing-universal-lifecycle-social-protection
[3] LFS 2019 Report, DCS. Available at:
http://www.statistics.gov.lk/LabourForce/StaticalInformation/AnnualReports/2019
[4] DCS, 2021. Colombo Consumer Price Index (CCPI)-(Base 2013=100), Department of Census and Statistics, Ministry of Finance. Available at: http://www.statistics.gov.lk/InflationAndPrices/StaticalInformation/MonthlyCCPI/CCPI_20210630E
[5] DCS, 2020. Retail Prices: Weekly Retail Prices for selected Consumer Items Colombo District, Open Market Weekly Average Retail Prices – 4th Week of February 2020. Available at:
http://www.statistics.gov.lk/InflationAndPrices/StaticalInformation/retail/DCSB-WRP-2020-02-W4
[6] DCS, 2021. Retail Prices: Weekly Retail Prices for selected Consumer Items Colombo District, Open Market Weekly Average Retail Prices – 1st Week of July 2021. Available at:
http://www.statistics.gov.lk/InflationAndPrices/StaticalInformation/retail/DCSB-WRP-2021-07-W1
[7] Colombo Consumer Price Index by Sub groups, DCS. Available at: http://www.statistics.gov.lk/InflationAndPrices/StaticalInformation/MonthlyCCPI/ColomboConsumerPriceIndexbySubgroups